This article is for quizzes on Tuesday May 19th...
The Big Mac Index is published by The Economist as an informal way of measuring the purchasing power parity (PPP) between two currencies and provides a test of the extent to which market exchange rates result in goods costing the same in different countries. It "seeks to make exchange-rate theory a bit more digestible".
![]() The index takes its name from the Big Mac, a hamburger sold at McDonald's restaurants.
The index takes its name from the Big Mac, a hamburger sold at McDonald's restaurants.
The Big Mac index was introduced in The Economist in September 1986 by Pam Woodall as a semi-humorous illustration of PPP and has been published by that paper annually since then. The index also gave rise to the word burgernomics.
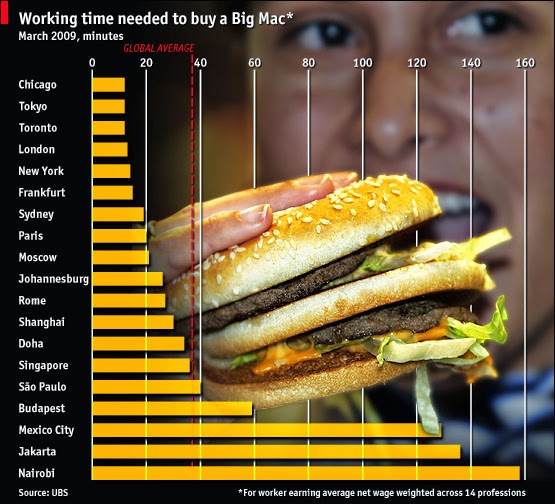
UBS Wealth Management Research has expanded the idea of the Big Mac index to include the amount of time that an average worker in a given country must work to earn enough to buy a Big Mac. The working-time based Big Mac index might give a more realistic view of the purchasing power of the average worker, as it takes into account more factors, such as local wages.
Six most expensive (12 January 2012) (not considering the fact that the buyer's equivalent purchasing power is different)
Six most affordable (12 January 2012) (not considering the fact that the buyer's equivalent purchasing power is different and not including the Indian Big Mac, which contains chicken instead of beef)
Eleven fastest earned (September 2012)
Ten slowest earned (September 2012)
The Big Mac Index is published by The Economist as an informal way of measuring the purchasing power parity (PPP) between two currencies and provides a test of the extent to which market exchange rates result in goods costing the same in different countries. It "seeks to make exchange-rate theory a bit more digestible".
The Big Mac index was introduced in The Economist in September 1986 by Pam Woodall as a semi-humorous illustration of PPP and has been published by that paper annually since then. The index also gave rise to the word burgernomics.
UBS Wealth Management Research has expanded the idea of the Big Mac index to include the amount of time that an average worker in a given country must work to earn enough to buy a Big Mac. The working-time based Big Mac index might give a more realistic view of the purchasing power of the average worker, as it takes into account more factors, such as local wages.
Six most expensive (12 January 2012) (not considering the fact that the buyer's equivalent purchasing power is different)
![]() Norway - $9.63 (59 kr.)
Norway - $9.63 (59 kr.)![]() Sweden - $7.29 (49 Kr.)
Sweden - $7.29 (49 Kr.)![]() Switzerland - $6.81 (6.50 CHF)
Switzerland - $6.81 (6.50 CHF)![]() Brazil - $5.68 (10.25 R$)
Brazil - $5.68 (10.25 R$)![]() Finland - $5.61 (4,10 €) (26 February 2014)
Finland - $5.61 (4,10 €) (26 February 2014)![]() Denmark - $5.37
Denmark - $5.37


Six most affordable (12 January 2012) (not considering the fact that the buyer's equivalent purchasing power is different and not including the Indian Big Mac, which contains chicken instead of beef)
![]() Hong Kong - $2.13 (16.5 HKD)
Hong Kong - $2.13 (16.5 HKD)![]() Russia - $2.15 (70 RUB)
Russia - $2.15 (70 RUB)![]() Ukraine - $2.33 (20 UAH)[21]
Ukraine - $2.33 (20 UAH)[21]![]() Malaysia - $2.34 (7.35 MYR)
Malaysia - $2.34 (7.35 MYR)![]() South Africa - $2.38 (20.90 ZAR)
South Africa - $2.38 (20.90 ZAR)![]() China - $2.44 (15.4 CNY)
China - $2.44 (15.4 CNY)


Eleven fastest earned (September 2012)
![Japan]() Tokyo– 9 minutes
Tokyo– 9 minutes![Hong Kong]() Hong Kong– 10 minutes
Hong Kong– 10 minutes![United States]() New York City– 10 minutes
New York City– 10 minutes![United States]() Chicago– 11 minutes
Chicago– 11 minutes![United States]() Los Angeles– 11 minutes
Los Angeles– 11 minutes![Luxembourg]() Luxembourg– 11 minutes
Luxembourg– 11 minutes![Canada]() Toronto– 11 minutes
Toronto– 11 minutes![United Arab Emirates]() Dubai– 12 minutes
Dubai– 12 minutes![United States]() Miami– 12 minutes
Miami– 12 minutes![Cyprus]() Nicosia– 12 minutes
Nicosia– 12 minutes![Australia]() Sydney– 12 minutes
Sydney– 12 minutes


Ten slowest earned (September 2012)


